Viral Load Chart of Hepatitis C
More than 170 million of the world population is either suffering from or is the carrier of Hepatitis C, a serious viral infection. Over four million Americans are infected with Hepatitis C virus (HCV) leading to an estimated 10000 deaths annually in the US alone. Hepatitis C is a grave disease, about which these pages have been written. An estimated 1.8% of the US population has been infected, which is more than 3.5 times HIV infection! Approximately 25000+ new cases are reported yearly in the US.
WHO estimates 3% of the world population suffering from Hepatitis C, aptly labeled as a time bomb, as many of the patients do not even know that they are carrying the virus in their blood.
The estimated 250000 people in Canada are HCV positive. It is strongly believed that the infection is spreading increasingly, principally due to ignorance and a lack of precise treatment.
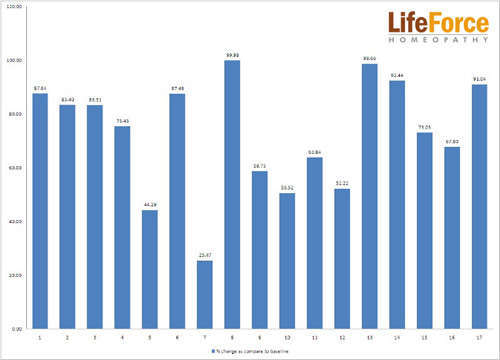
The fact sheet below indicates the viral load after our treatment:
Click here to examine case studies in detail.
|
No.
|
Patient's Description
|
Patient Ref. No.
|
Genotype
|
Duration
|
Before Treatment (IU/mL)
|
After Treatment (IU/mL)
|
% change as compared to baseline
|
|
1
|
Male, 31 years
|
L-6791
|
|
6 Months
|
15880753
|
1963643
|
87.64
|
|
2
|
Female, 30 years
|
6226
|
III-A
|
3 Months
|
2590000
|
430000
|
83.40
|
|
3
|
Male, 55 years
|
L-7590
|
-
|
3 Months
|
127000
|
21200
|
83.31
|
|
4
|
Male, 69 years
|
5796
|
III
|
10 Months
|
1508159
|
370271
|
75.45
|
|
5
|
Female, 53 years
|
L6333
|
III, IV
|
7 Months
|
233000
|
129815
|
44.29
|
|
6
|
Female, 33 years
|
L8247
|
-
|
12 Months
|
1785714
|
223656
|
87.48
|
|
7
|
Male, 40 years
|
9239
|
-
|
6 Months
|
283092
|
211000
|
25.47
|
|
8
|
Male, 26 years
|
9102
|
III
|
7 Months
|
104129
|
20
|
99.98
|
|
9
|
Male, 41 years
|
9551
|
-
|
5 Months
|
25700000
|
10600000
|
58.75
|
|
10
|
Female, 47 years
|
10790
|
III-A
|
2 Months
|
764200
|
378100
|
50.52
|
|
11
|
Female, 45 years
|
9298
|
1-A
|
13 Months
|
645210
|
233310
|
63.84
|
|
13
|
Female, 53 years
|
6333
|
III, VI
|
4 Months
|
144000
|
1926
|
98.66
|
|
14
|
Male, 75 years
|
9657
|
I, B
|
4 months
|
307500
|
23250
|
92.44
|
|
16
|
Male, 25 years
|
11245
|
III
|
11 months
|
4690000
|
1510000
|
67.80
|
|
17
|
Female, 54 years
|
10315
|
III
|
10 months
|
11500000
|
1030000
|
91.04
|
The following graph shows the change in percent of viral load after homeopathic treatment.
(Click on photo to enlarge.)
Written & Approved by-
Dr. Rajesh Shah
M.D. (Hom.)